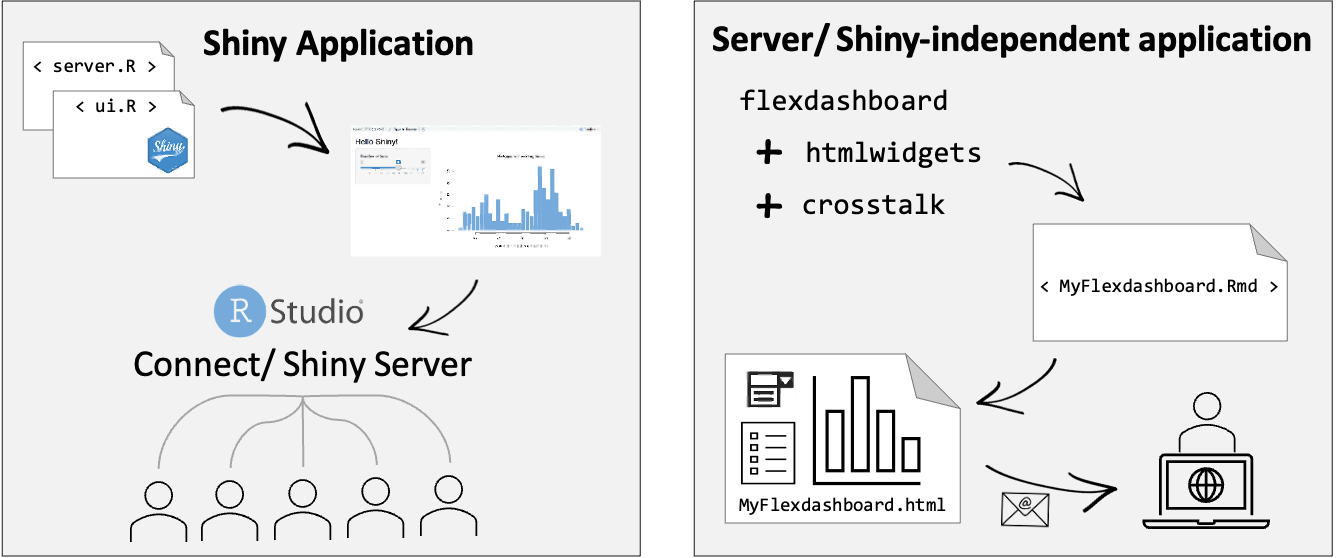
How to use {flexdashboard}, {htmlwidgets} + {crosstalk} to build interactive and self-contained dashboards.
Author
Sereina M. Graber
Published
March 25, 2021
In many analytical projects, I encounter situations where I need to summarize and present results — such as descriptive statistics or time trends — for hundreds of medications or other health services. In such cases, producing static reports that span hundreds of pages with tables and figures is neither efficient nor user-friendly. Interactive dashboards offer a powerful alternative. They allow stakeholders to explore results dynamically, focus on specific areas of interest, and gain insights much more intuitively than through static tables or figures. However, a major challenge arises when these results need to be shared with external collaborators.
While the R Shiny framework is a very cool tool for building interactive web applications in R, it requires a running R server (or RStudio Connect), which may either not be part of the existing infrastructure or be inaccessible to external collaborators. In such cases, a server-independent, self-contained interactive dashboard becomes an ideal solution. The {flexdashboard} package, in combination with {htmlwidgets} and {crosstalk}, enables the creation of fully self-contained dashboards that can be exported as simple HTML files retaining full interactivity — making them easy and secure to share, even via email.
Interactive Analytics Without a Server: {flexdashboard} and Friends
The first piece of the puzzle is {flexdashboard}, a handy framework in R for building dashboards. What’s great about {flexdashboard} is that the dashboard is a simple R markdown file and the result is just a plain HTML — no server required. You can still include Shiny components if you want (like an interactive plot), but you don’t have to. Instead, you can use {htmlwidgets}, which makes the whole setup fully interactive and completely server-independent. The package enables customizable layouts using R markdown syntax, allowing you to organize content into rows and columns easily, add navigation menus, tabs, and various themes to enhance the user experience.
So what are htmlwidgets? They’re basically a collection of R packages that allow interactive web visualizations, in other words R-friendly wrappers for popular JavaScript visualization libraries. You can easily drop them into Shiny apps or R markdown reports, such as one built with {flexdashboard}. Some popular widgets are {plotly} (for interactive charts), {DT} (for sortable and filterable tables), and {Leaflet} (for creating dynamic maps). The {htmlwidgets} package itself allows you to create your own widgets.
Then there’s {crosstalk}, a really useful add-on for the mentioned htmlwidgets. It lets multiple widgets talk to each other — so when you filter or select something in one widget, others update automatically. To make this work, the underlying data needs be wrapped in a SharedData object, and as long as the widgets are crosstalk-compatible (see full list here), they’ll stay connected and respond to each other. The package contains various filter widgets (like dropdowns, sliders, checkboxes) that you can easily add to your dashboard to control the displayed data. The biggest limitation is that {crosstalk} only works with pre-calculated data (filters and links of views that display individual rows of data), so you can’t do complex computations on the fly like in Shiny.
Demo App
This following demo dashboard built based on {flexdashboard} and {crosstalk} let users explore the mtcars dataset with a {DT} datatable and two {plotly} plots that update together as you filter the data.
The sidebar filters (checkboxes, a slider, and a dropdown) let you choose cylinders, horsepower, and transmission type, and all three views change instantly. Thanks to SharedData$new(), {crosstalk} links the table and plots , making it easy to explore the data interactively and without any server setup.
R markdown: Demo flexdashboard + htmlwidgets + crosstalk
---title:"Demo flexdashboard + htmlwidgets + crosstalk"output: flexdashboard::flex_dashboard: orientation: rows vertical_layout: fill---```{r setup, include=FALSE}library(flexdashboard)library(plotly)library(DT)library(crosstalk)shared_mtcars <- SharedData$new(mtcars)```Inputs {.sidebar}--------------------------------------------------------------------------------```{r}crosstalk::filter_checkbox("cyl", "Cylinders", shared_mtcars, ~cyl, inline = TRUE)crosstalk::filter_slider("hp", "Horsepower", shared_mtcars, ~hp, width = "100%")crosstalk::filter_select("auto", "Automatic", shared_mtcars, ~ifelse(am == 0, "Yes", "No"))```Row {.tabset}--------------------------------------------------------------------------------### Table `{DT}````{r}datatable(shared_mtcars)```### Data\`mtcars`: The data was extracted from the 1974 Motor Trend US magazine, and comprises fuel consumption and 10 aspects of automobile design and performance for32automobiles (1973–74 models).*`mpg`- Miles/(US) gallon*`cyl`- Number of cylinders*`disp`-Displacement (cu.in.)*`hp`- Gross horsepower*`drat`- Rear axle ratio*`wt`-Weight (1000 lbs)*`qsec`-1/4 mile time*`vs`-Engine (0= V-shaped, 1= straight)*`am`-Transmission (0= automatic, 1= manual)*`gear`- Number of forward gears*`carb`- Number of carburetorsRow--------------------------------------------------------------------------------### Chart A `{plotly}````{r}#d3scatter(shared_mtcars, ~wt, ~mpg, ~factor(cyl), width="100%", height=250)plot_ly(shared_mtcars, x = ~wt, y = ~mpg, color = ~factor(cyl), type = 'scatter', mode = 'markers', width = NULL, height = 250) %>% layout( xaxis = list(title = "wt"), yaxis = list(title = "mpg"), legend = list(title = list(text = "cyl")) )```### Chart B `{plotly}````{r}#d3scatter(shared_mtcars, ~hp, ~qsec, ~factor(cyl), width="100%", height=250)plot_ly(shared_mtcars, x = ~hp, y = ~qsec, color = ~factor(cyl), type = 'scatter', mode = 'markers', width = NULL, height = 250) %>% layout( xaxis = list(title = "wt"), yaxis = list(title = "mpg"), legend = list(title = list(text = "cyl")) )```
Pros & Cons for Interactive Standalone Apps
Using {flexdashboard} together with {htmlwidgets} and {crosstalk} is a very simple way to build interactive, standalone applications. It offers a nice solution for presenting results in a compact, clear, and interactive way, and the fact that it works without a server means it can be shared easily via email and no admin/ infrastructure hassle.
The probably biggest limitations, however, are that these dashboards are essentially static — all metrics need to be pre-calculated, filtering options are basic, and the choice of the htmlwidgets is somewhat restricted. Furthermore, large datasets can make these types of dashboards very slow.
All in all, this approach is perfect for small to medium-sized analytical projects where clarity, interactivity, and easy sharing are important.