R/ Medicine 2025 · Personal Highlights
R in healthcare and medical research. I share my highlights, and useful resources.
I attended the R/ Medicine virtual conference for the first time this year (2025). The conference is focused on the use of R in healthcare and medical research, running since 2018, and it features a combination of hands-on workshops and presentations. Initiated by the R Consortium and sponsored by Posit and Genentech, R/ Medicine stands out for its accessibility — conference fees remain very affordable even for non-students.
The following section highlights my favorite sessions, condensed to their key takeaways, and mainly serves as a repository for links to presentations and workshop materials.
Supercharging Statistical Analysis with ARDs and the {cards} R Package · Becca Krouse and Davide Garolini, GSK/Roche

As a big fan of {gtsummary}, I was very curious to hear about the {cards} and {cardx} packages.
For context, ARD (Analysis Results Data) refers to the “flat” dataset that contains the results of analyses - like summary statistics, model estimates, and p-values - for e.g. demographics or adverse events. CDISC ARS (Analysis Results Standard) defines how these results and their metadata should be structured, linked, and documented, enabling automation, reproducibility, and fully auditable traceability supporting regulatory submissions (CDISC is the organisation making the standards).
The {cards} package builds on the functionality of {gtsummary} to make creating ARDs simple and efficient, while its companion, {cardx}, extends these capabilities, allowing you to export ARDs from a wide range of statistical methods and packages including {geepack}, {lme4} and {survival}.
Find the material and slides here and some further material from the R/ Pharma workshop in 2024:
A Practical Workshop for Creating and Utilizing ARDs for Clinical Reporting.
Ellmer - Demistifying LLMs · Joe Cheng, CTO Posit
Joe Cheng provided a concise overview of how LLMs work, explaining the core concepts that are essential for anyone looking to use them effectively. Joe showcased three R packages ({ellmer}, {shinychat}, {querychat}) designed to interface with large language models (LLMs), making it easy for developers to build interactive, AI-driven applications. In addition to the packages, he also introduced the concept of Tool Calling — a feature that enables LLMs to invoke external functions or tools to extend their capabilities, i.e. supply the LLM with up-to-date, real-time data.
He compared the strengths of different LLM providers, noting that OpenAI’s models excel at general-purpose tasks and conversation, while Anthropic’s models tend to perform better in code generation. Finally, he shared practical tips for prompt engineering, showing how thoughtful prompt design can significantly improve model performance and output quality.
Find the slides here and workshop material here.

provides unified R interface to a variety of LLMs & providers (OpenAI, Anthropic, etc), supporting streaming output, extraction of structured data and tool calling. Check out Getting started with ellmer for core concepts and examples.

makes it simple to integrate AI-driven conversations into Shiny apps. It offers ready-to-use chat components (chat interface, streaming chat) and live streaming responses that connect with {ellmer} on the backend.

is also a Shiny-component package, specialized for data-frame querying — it lets users chat in natural language and retrieve results (filters, sorts, summaries) from a data frame by having the LLM generate SQL queries under the hood.
Retrospective clinical data harmonisation reporting · Jeremy Selva, National Heart Center Singapore
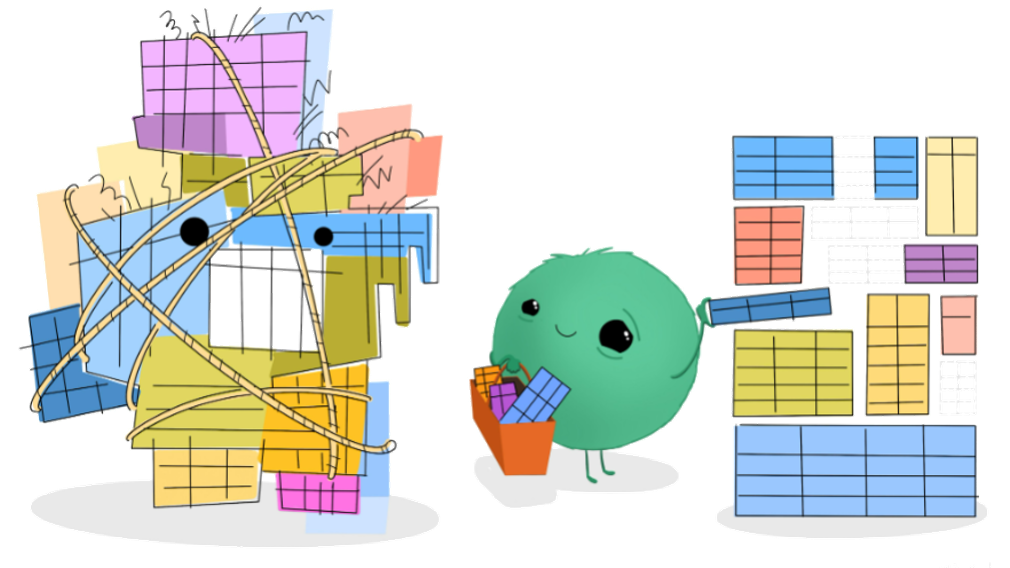
Jeremy Selva shared a comprehensive workflow for retrospective clinical data harmonization using R, demonstrating how to ensure data quality, consistency, and reproducibility across diverse datasets. He demonstrated practical strategies for standardising clinical data from diverse sources to improve the reliability of analyses, and showed how to create an automated technical report that transparently documents the data processing workflow — fostering clarity and traceability both for oneself and for collaborators in research projects.
Find the slides here and his data-harmonization-project-template here.
A few useful tools I discovered along the way:
- Cleaning Medical Data with R workshop by Shannon Pileggi (R/ Medicine 2023).
{vroom}package for fast data reading including the functionproblems()which retrieves a data frame with one row for each potential problem in your data.

{pointblank}package for data validation (-reporting) - in data frames or on database tables. It allows you to create validation steps and generate reports on data quality.
Visualise, Optimise, Parametrise · Cara Thompson, Data Viz Consultant
Writing dataviz code that your future self will thank you for!
I often find myself spending a lot of time fine-tuning visualizations to make them visually appealing - reusing similar code again and again, not only for publications but also for quick, ad-hoc analyses. These are what Cara Thompson calls those “can you just?” moments. In her workshop, Cara clearly illustrated why and how to parametrize plots — so our future selves can spend less time tweaking and more time thinking.
Find the slides for the workshop here.
A couple of really cool tools and tricks I learned for making plots smarter and faster:
- Choose and blend colors using her {monochromeR} package and the corresponding Shiny app. For even more details on
{monochromeR}, see her website.
- In
{ggplot2}use thebase_sizeargument in combination withrel()to set relative sizes of text elements. Example:theme_minimal(base_size = 16)andelement_text(size = rel(0.8))for axis text.
- Put
{ggplot2}theme-definitions/ plots into functions! and useget()for getting e.g. grouping variable in a function. Example:function(group_var = "species")and inside the functiondf |> group_by(group = get(group_var)).

R Package Development with GitHub Pages and {pkgdown} · Melissa Van Bussel, Statistics Canada
Besides the creation of a basic package, the workshop covered setting up a customized package website with {pkgdown} and GitHub Pages. Along the way, Melissa shared many useful tips and tricks using the {usethis} package.
Find the slides of the workshop here and the GitHub repository here.
My result of the pkgdown site: serigra.github.io/rmedicine/ (GitHub repo).
- Setup
usethis::git_sitrep(): situation report / check GitHub configuration.
- Package Creation
- file > new project > new directory > R package using devtools
DESCRIPTIONfile:usethis::use_mit_license(), change version number of something shortusethis::use_readme_md(): will open README.md, which will be the homepage of our pkgdown siteusethis::use_r("my_function): will open an R fileusethis::use_test("my_function"): will open a test file
- Put up to GitHub Pages
check(): check if package is workingusethis::use_git()to initialize gitusethis::use_github(): creates repo on GitHubusethis::use_pkgdown_github_pages(): creates pkgdown site and pushes to GitHub pages. Whenever push to main branch, website will be automatically updated.usethis::build_site(): view pkgdown site locally
- Customization of Pkgdown Site
- hex-logo: hexmake Shiny app or {
hexSticker} package usethis::use_logo("path_to_logo"): adding logo in right locationpkgdown::build_favicons(): create favicons- …many more customization tips in the slide deck.
- hex-logo: hexmake Shiny app or {
- GitHub Actions and GitHub Pages
- GitHub Pages will host any page that ends up in our
/docsfolder .github/workflows/pkgdown.yaml: is automatically built byusethis. When push to main branch, the terminal commands in this file are run -> defines workflow pipeline.
- GitHub Pages will host any page that ends up in our
- Important Difference
_pkgdown.ymlvs.pkgdown.yaml: first controls how pkgdown site looks like, second is for GitHub actions.